Facebook’s developers are mostly Apple People, so they don’t waste many mental cycles fretting over React-Native developers who are on other platforms. I don’t like straying too much from the main path when it comes to deciding on which tools to use, so I wondered if it was advisable—or even possible—to debug React Native at all on Windows. Google Search didn’t reveal much information about what Windows React-Native developers do when their app crashes with no error message. I’ve read that debugging can be done from Visual Studio Code, but I’d much rather edit JavaScript with a JetBrains editor, so I first tried Android Studio. Unfortunately, AS assumes you’re developing in Java, and you can only install basic JavaScript highlighting features on AS, so that wasn’t much help.
Fortunately it IntelliJ Ultimate can be configured to do everything Android Studio does, plus it is a full-fledged JavaScript IDE. Here’s how I was able to get this working. (And no, this won’t work for iOS.)
Set Up IntelliJ
Download and install IntelliJ Ultimate. Use the 30-day evaluation. It’s cheap to purchase and it’s the best development tool anywhere. The community version is good, but it lacks some essential pieces like JavaScript/TypeScript tools.
Go to File -> Settings -> Plugins and make sure the Android Support plugin is enabled.
Install the Android SDK Tools and set up the Android Emulator
Follow the IntelliJ instructions for installing the Android SDK Tools. You
need to install specific versions of several libraries, so it’s best to check there
for the most current requirements. It isn’t clear from the instructions—the
Android SDK site has changed recently, so it’s out-of-synch with the IntelliJ site—but you need to download the
SDK tools, (e.g. tools_r25.X.X-windows.zip) not the full Android
Studio. When it downloads, unzip it somewhere and run tools/android.bat. The directory you create from the downloaded
file (e.g. C:\tools_r25.3.3-windows) will be your ANDROID_HOME environment variable.
From this directory, run tools/android.bat This will launch the Android SDK manager.
Set up the Google emulator as per Facebook’s Instructions. The interface for this seems confusing—it didn’t install everything I checked the first time, presumably because several libraries had different EULAs. Keep clicking the “install” button until there’s nothing left in the queue.
The second time I ran through this procedure, it told me I couldn’t instantiate a virtual device, because “HAXM” was not installed, but the button to install HAXM didn’t work. So I set it up manually from the Intel Site.
React-Native setup
Do all the usual Node/React-Native setup if you haven’t done it already.
You may want to install yarn to speed things up: npm install -g yarn.
Create a Project
Create a new project:
> react-native init AwesomeProject
Then open the project in IntelliJ. It should tell you “Android framework is detected in the project”. If it isn’t, you may have to go back and make sure the Android Plugin is enabled.
Go to File -> Project Structure -> Project Settings -> Project
then select the “Dependencies” tab and select “Android 6.0 Google APIs” under “Project SDK”.
Go to File -> Project Structure -> Project Settings -> Modules
then select the “Dependencies” tab and select “Android 6.0 Google APIs” under “Module SDK”.
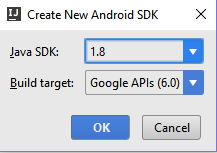
Go to File -> Project Structure -> Platform Settings => SDKs
- click the “+” sign to add a new sdk. It will prompt you for the location of the
“Android SDK Home Path”, which is the same as the
ANDROID_HOMEvariable you set.
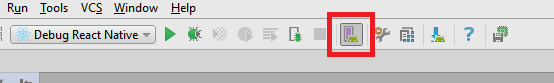
Now you should have some tools in Tools -> Android. Turning on
View -> Tool Buttons is a quick way to enable the AVD
Manager in the toolbar.
At this point I also added my ANDROID_HOME/tools and ANDROID_HOME/platform-tools to my PATH so that
I can use the command line.
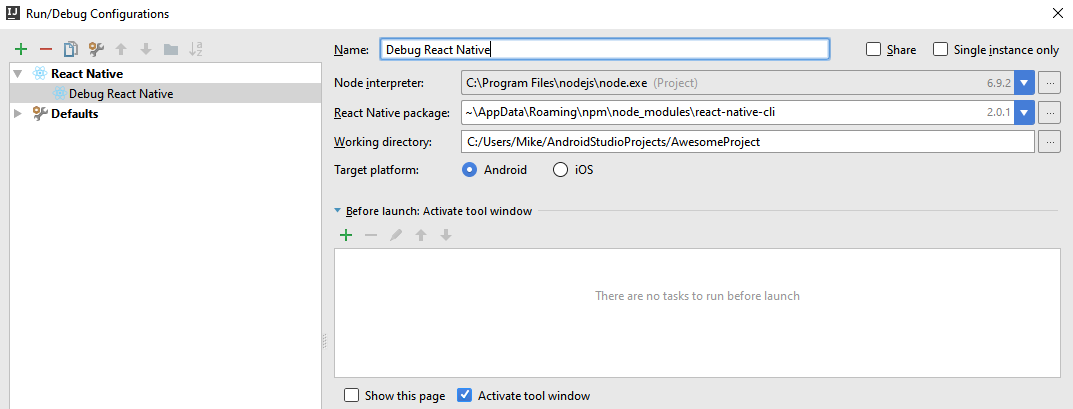
Create a “Debug Configuration”
Run -> Edit Configurations, hit the Plus sign and choose React Native.
Launch the Android Emulator
Click on the “AVD manager” icon (or find it under Tools -> Android), and
run the image that you configured
for React Native. (I had to restart IntelliJ to enable the AVD manager button the first time.)
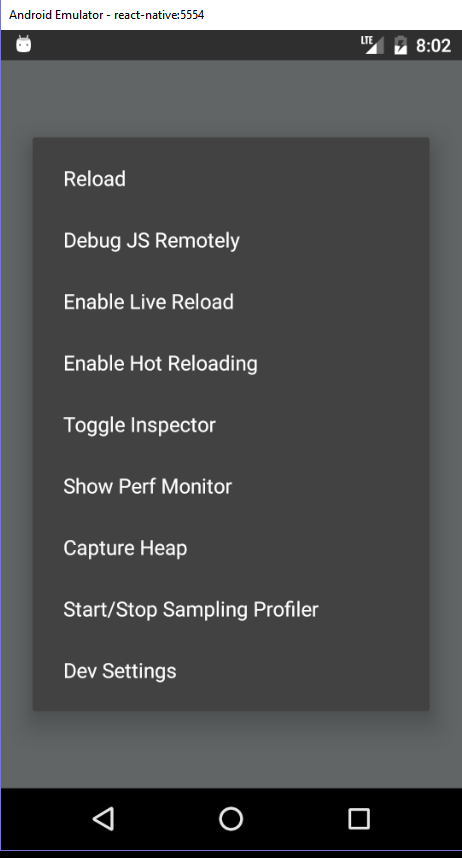
When Android boots up, type Ctrl + M and select “Debug JS Remotely”. (On Apple it’s CMD-D).
Start Debugging
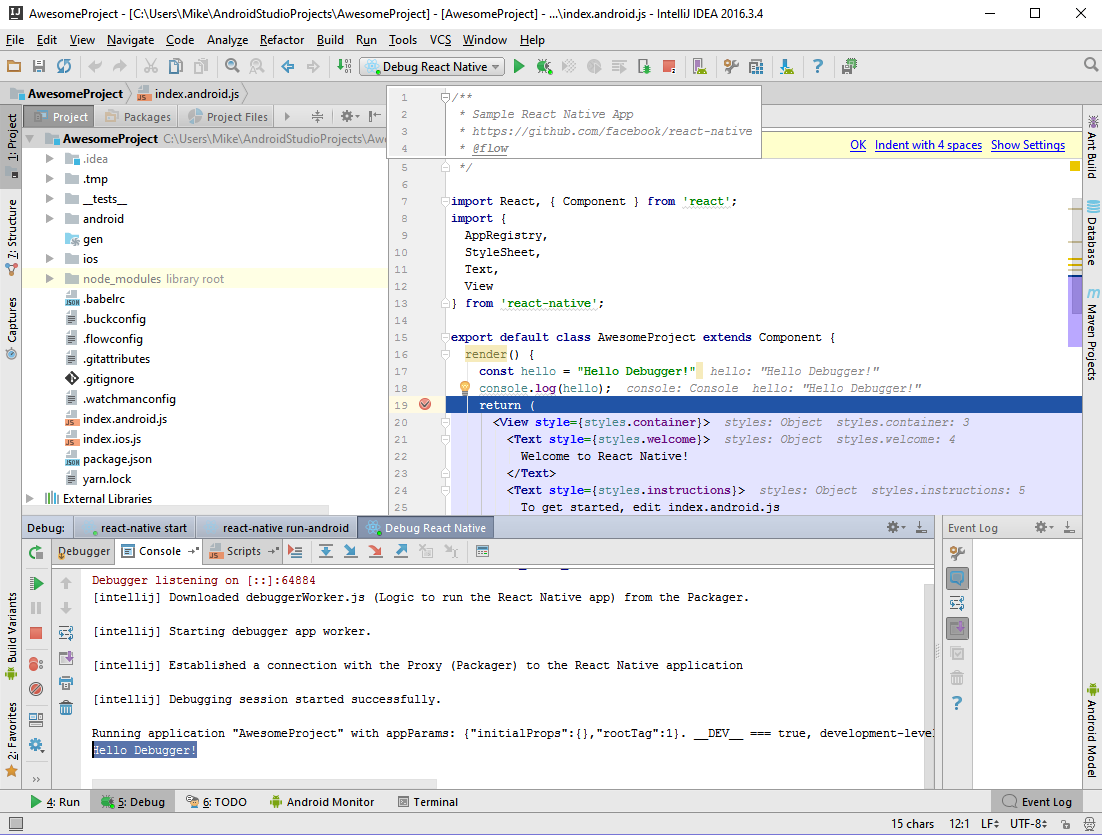
If all goes well to this point, you should be able to go to Run -> Debug and run the Debug Configuration
that you set up. (I had to stop and restart my app the first time before it worked
correctly.)
Below you can see that I set a breakpoint at line 19, and was able to capture the console.log output “Hello Debugger”
in the lower IntelliJ console window.